We are excited to announce that PromLabs and Chronosphere have donated PromLens to the Prometheus project under an open-source license. PromLens is now available to anyone without a license key! Learn more in our announcement blog post about the open-sourcing.
The power tool for querying Prometheus
Build, understand, and fix your queries much more effectively with the ultimate query builder for PromQL
Built by the co-founder of Prometheus and creator of PromQL
Take the guesswork out of your PromQL
- Don't remember the syntax?
- Trying to track down an error?
- Unsure what data you are working with?
- Having trouble understanding a complex query?
- Wondering why a query returns an empty result?
- Want best-in-class autocompletion, highlighting, and linting?
Whether you are building queries for dashboards, alerts, or ad-hoc insights, PromLens takes the frustration out of working with PromQL and helps you build, understand, and fix your queries in a much more effective way.
Edit confidently
Get best-in-class autocompletion, highlighting, and inline linting while typing an expression.
The metric names, label names, label values, function names, operators, and modifiers, are completed and linted contextually.
Build visually
Create and modify PromQL queries using a form-based editor.
No need to memorize or look up all PromQL language details. The form-based editor makes all query types and options accessible in a visual way.
Debug & fix
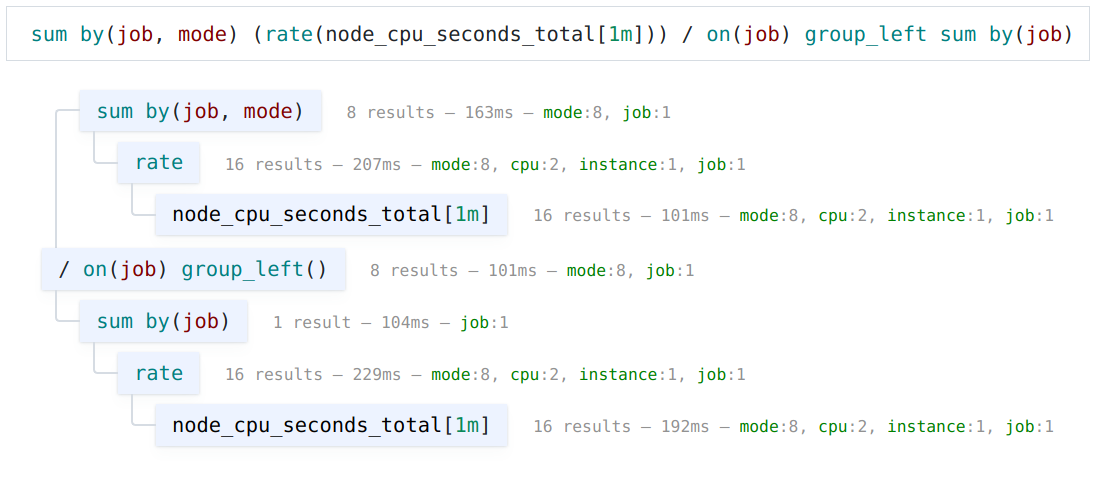
Enter any PromQL query and visualize all of its sub-expressions as a tree.
Instantly see the number of results, available labels, and potential errors, at every part of the query.
X-ray your data
Get immediate deeper insights about the values of any label in the tree, along with their number of occurrences.
Hints & Actions
PromLens detects common query patterns and pitfalls and will offer you warning hints and actions that you can apply with a press of a button.
Connect to any PromQL-compatible system
PromLens works with any PromQL-compatible endpoint, like Prometheus itself, Thanos, Cortex, Timescale / Promscale, and other compatible systems.

Visualize
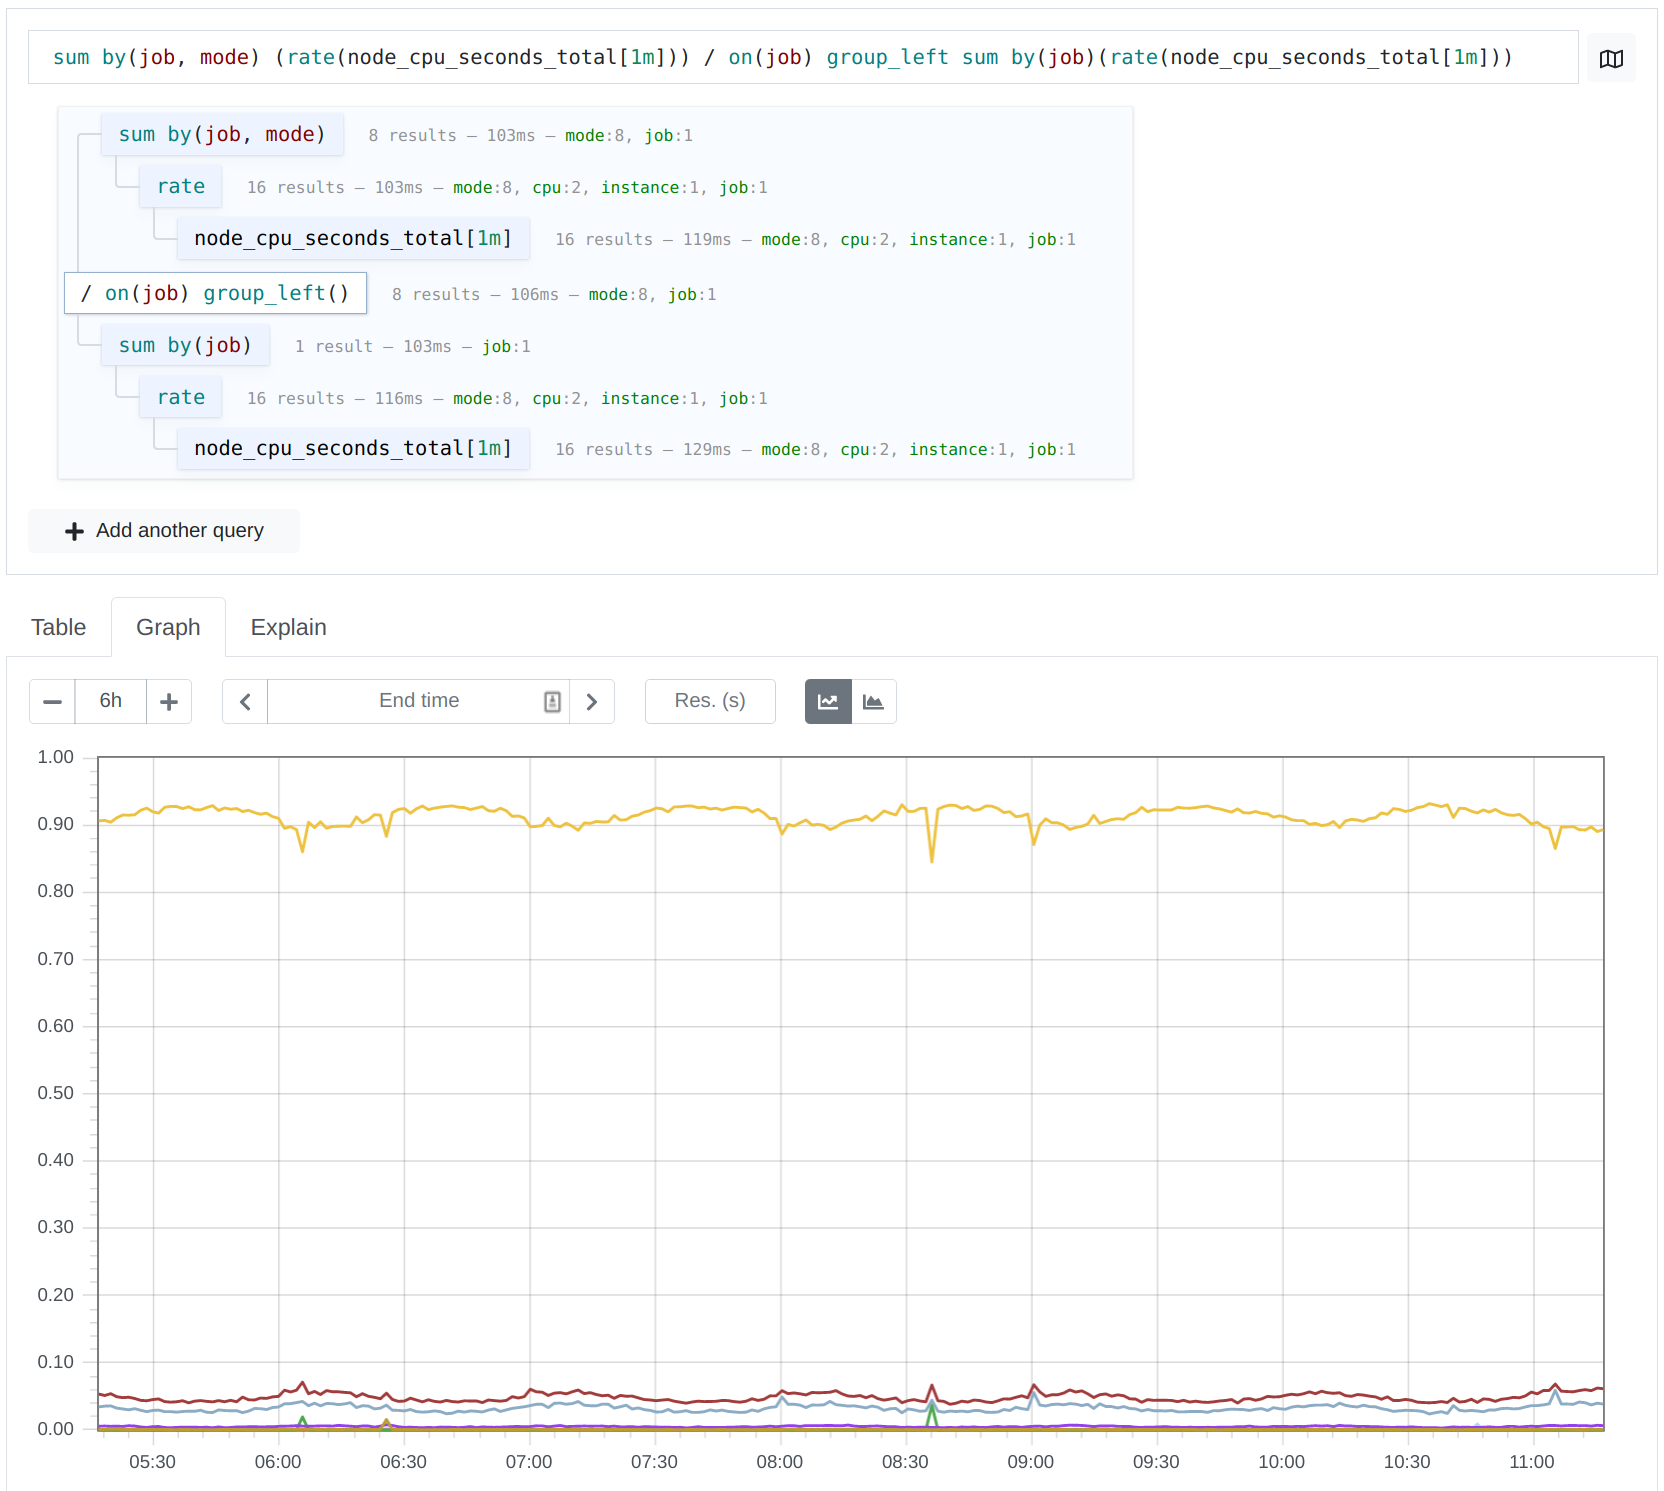
Show any part of a query tree as a table or a graph.
Whereas Prometheus can only execute an entire query, PromLens allows you to visualize any part of the query tree.
Learn & Understand
Understand what each part of a query is doing, and how it works under the hood.
The query explain view tells shows you how binary operators match series together, what functions do, and more.
Explore
Explore all metrics along with their metadata.
PromLens has a built-in metrics explorer that allows you to see and filter all available metric names, along with their metric type and documentation string.
Deploy PromLens
Deploy PromLens as a Docker container. Getting started with the free version is simple:
$ docker run -p 8080:8080 prom/promlensShare
Make any PromLens page shareable with all its state.
Whether you are a newbie wanting to get help from an advanced user or an expert showing a query to a beginner, sharing a PromLens page is a great way to start learning and talking about queries together.
Connect to Grafana
PromLens can connect to your existing Grafana installation to let you select and query Prometheus datasources configured in Grafana.
